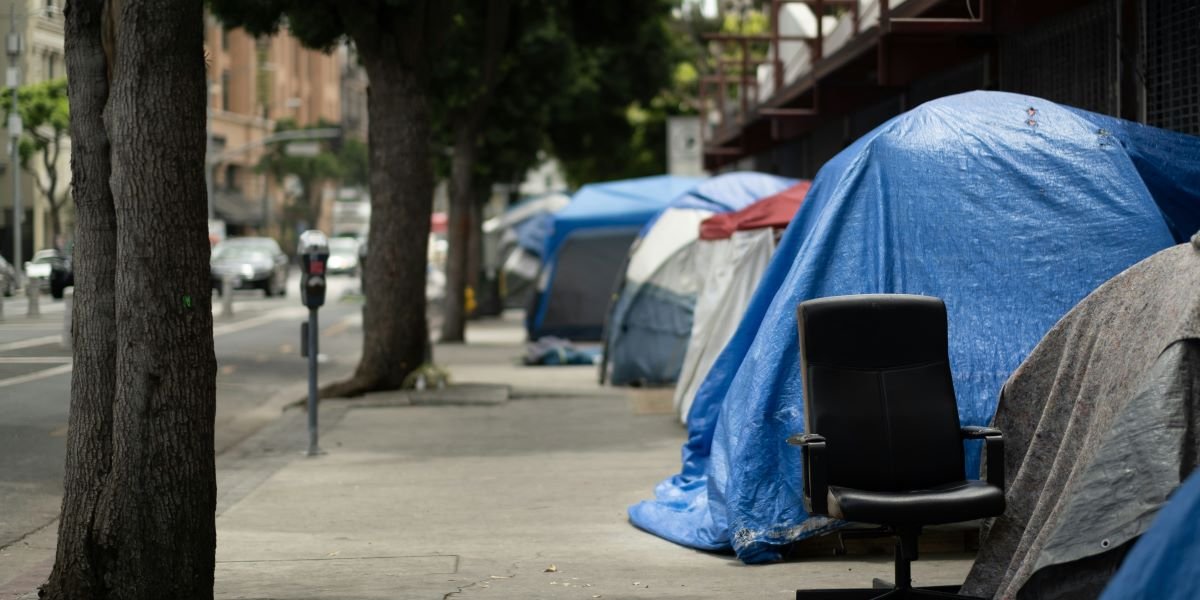

California’s estimated unsheltered homeless population fell 6.5% in 2026 compared with 2025, according to preliminary statewide data the Governor’s office released October 28. It is the second straight annual decline, bringing the two-year drop to 12.8% and putting unsheltered homelessness slightly below 2019 levels, according to state estimates.
Key Takeaways
- Preliminary estimates show unsheltered homelessness down 6.5% statewide from 2025, while total homelessness fell 3.4%.
- Since 2024, unsheltered homelessness is down an estimated 12.8% and total homelessness 6%.
- 37 of California’s 44 homelessness planning regions conducted new unsheltered counts this year, covering nearly 90% of the state’s 2025 unsheltered population.
- Federal HUD data for 2025 showed California’s unsheltered homelessness fell 6.77%, compared with 2.88% nationwide.
- The 2026 figures are preliminary and come before the federal government releases its national 2026 count.
Preliminary Data Show A Second Year Of Decline
The new estimates suggest California’s homeless numbers, after rising for years, are now moving in the other direction. Statewide, unsheltered homelessness, which counts people living outdoors, in vehicles, or in places not meant for habitation, fell an estimated 6.5% from 2025 to 2026. Total homelessness, which also includes people staying in shelters, fell 3.4%.
Over two years, the change is larger. Unsheltered homelessness is down an estimated 12.8% since 2024, and total homelessness is down 6%. According to the state, this is the first time since 2013–14 that both measures declined in back-to-back years. Federal data supports the first year of that trend: HUD’s 2025 figures showed California’s unsheltered population fell 6.77%, while the national decline was 2.88%.
How The State Built Its 2026 Estimate
The numbers come from point-in-time counts, one-night surveys that local Continuum of Care agencies conduct to estimate how many people are experiencing homelessness. California has 44 of these regions. This year, 37 of them conducted new unsheltered counts, and together they held nearly 90% of the state’s 2025 unsheltered population.
Within those 37 regions, unsheltered homelessness fell 7.3% compared with their most recent previous counts, taken in either 2024 or 2025. To produce a statewide figure, the state followed HUD’s practice of combining the new counts with the last reported numbers from the seven regions that skipped a count this year. That produces the 6.5% statewide decline. Point-in-time counts have limits. They capture one night, not the full year, and people who are homeless only briefly can be undercounted.
Total Homelessness Fell More Slowly Than Unsheltered Counts
The gap between the two figures matters for understanding the data. Unsheltered homelessness fell almost twice as fast as total homelessness. When more people move from the street into shelter, unsheltered counts drop, but those individuals are still counted as homeless. An analysis of 2025 federal data by the Public Policy Institute of California found that sheltered homelessness rose about 5% even as the overall number declined.
For cities and counties, that distinction shapes the next step. More shelter beds can reduce visible street homelessness quickly, while lowering total homelessness depends on moving people into permanent housing.
Results Vary Widely Across California Regions
The statewide decline does not reflect every community’s experience. Los Angeles County’s latest count showed little overall change, with fewer people moving into permanent housing last year. Contra Costa County, after a significant drop between 2024 and 2025, saw homelessness rise 7% this year.
Fresno and Madera counties reported a combined 34% drop, but local officials acknowledged that a change in counting methods makes their 2026 figures difficult to compare with 2025. These differences show why residents should read their own region’s count alongside the statewide number.
Programs The State Credits For The Decline
The Governor’s office credits several state programs for the trend, though no independent analysis has yet isolated their individual effects. Proposition 1, approved by voters in 2024, funds behavioral health facilities and housing. When fully awarded, it is expected to create at least 6,800 residential treatment beds and 26,700 outpatient treatment slots.
The state also points to CARE Court, which creates court-administered treatment plans of up to 24 months for people with schizophrenia and other psychotic disorders, and to updated conservatorship laws covering severe substance use disorder and serious mental illness. On encampments, the state reports that Caltrans has removed more than 19,000 encampments from state property since 2021. “California is proving that homelessness is not inevitable,” Governor Gavin Newsom said in the announcement.
What To Watch When Federal Data Arrives
The 2026 figures will stay preliminary until HUD publishes its national point-in-time findings, which will also show how California compares with other states this year. Final data could shift the estimates, particularly for the seven regions that carried forward older counts. Watch whether permanent housing placements rise alongside shelter use, and whether regions with flat or rising counts, such as Los Angeles and Contra Costa, begin to follow the statewide trend.
FAQs
Is Homelessness Going Down In California?
Preliminary 2026 estimates show unsheltered homelessness down 6.5% and total homelessness down 3.4% from 2025. It is the second straight year of decline, though results vary widely by county.
What Is The Difference Between Sheltered And Unsheltered Homelessness?
Unsheltered homelessness counts people living outdoors, in vehicles, or in places not meant for housing. Sheltered homelessness counts people in emergency shelters or transitional housing, who are still considered homeless.
Are California’s 2026 Homelessness Numbers Final?
No. The 2026 figures are preliminary state estimates released before HUD’s national 2026 report. They include older counts from seven regions that did not conduct a new count this year.
What Is A Point-In-Time Count?
A point-in-time count is a one-night survey that local agencies conduct to estimate how many people are experiencing homelessness. It does not capture everyone who loses housing over a full year.